Watch on YouTube: https://youtu.be/SIaZ_FxCq6Y
On October 6, 2026, OpenAI made a public library of math papers. The library holds 719 manuscripts, grouped into 372 families of related papers. One author name is on each paper: OpenAI. The company says an unreleased internal AI model wrote them. Its own notes add that at least one write-up had human help with editing.
Some of these papers aim at questions that mathematicians have been chasing for decades. A few aim at questions that are about a hundred years old. If the papers are right, this is a strange and big day for mathematics. A machine would have finished work that rests on decades of human results, on questions the best human minds chased for a lifetime.
But there is a big "if". A math paper is a long chain of steps. One wrong sign on one page can break every page after it. That happened here once already. On October 7, OpenAI withdrew three manuscripts after a sign error.
Reactions split. Columbia's Michael Harris said he would not read the papers. Oxford's Ursula Martin called the release a messy first draft. Cornell's Alex Townsend said OpenAI should have led with the results already checked in Lean.
So this article does two things. It explains eleven of the claims with pictures a ten-year-old can hold. And it tells you, for each one, how far the checking has gone. You will see one word again and again: claimed. That is the honest word for now.
Three checks matter. First, did outside experts read the paper and agree? Second, did a journal referee it? Third, is there a Lean proof, and does its statement match the paper? Lean is a computer program that checks a proof, step by step, against a written statement. Lean is strong, but a person must still check that the statement says the right thing. OpenAI's own README says only about 42% of its top results have a Lean proof, and that some of the rest "could have issues." We, the team behind this article, read some of the Lean files but did not run them.
Every picture in this post is live in The October Proofs, an interactive companion. Drag, play and record each one.
Watch the Full Film
The film is about 15 minutes long. It shows all eleven claims with moving pictures, in the same order as this article. Watch it first, or read first and watch after.
Watch on YouTube: https://youtu.be/7U1TVt8HojI
1. Kakeya: How Little Floor Does a Needle Need?
The question. Put a needle of length 1 on a table. You must turn it until it points the other way. How much table must it touch?
A picture to hold. Spinning the needle in place, like a clock hand, is the obvious move. It sweeps a disk with an area of about 0.785. Now let it slide while it turns, inside a three-cornered curved shape called a deltoid. It needs only half the area, about 0.393. Try it with a pencil on your desk. Sōichi Kakeya asked this question in 1917.
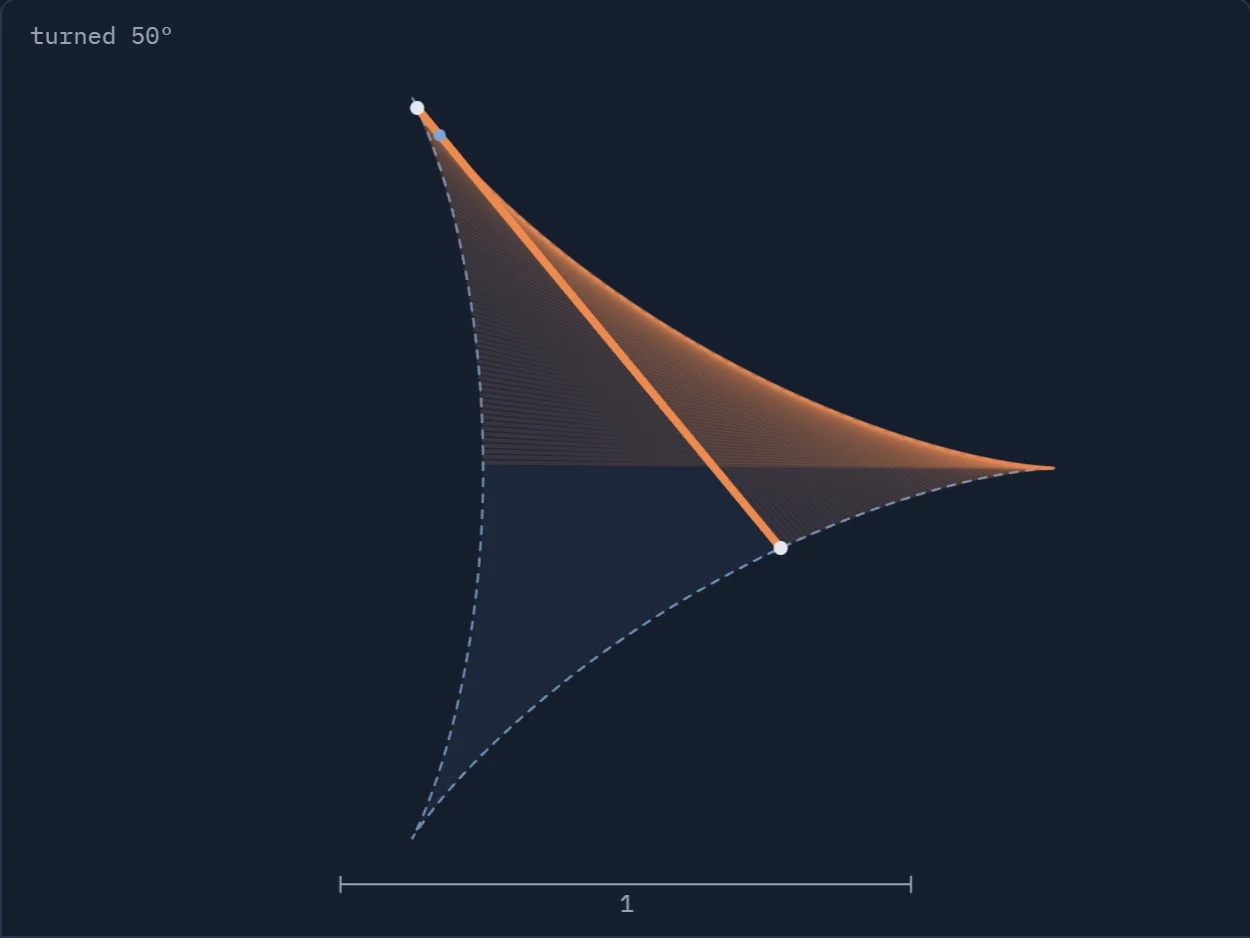
Try it. Press Spin in a disk, then Slide in a deltoid. Watch the area readout each time.
What to look for. Both regions let the needle turn all the way round. The deltoid does it on half the floor, 0.393 against 0.785. That first surprise starts the whole Kakeya story.
Play with this figureIn 1928 Abram Besicovitch found a surprise. With long detours, the needle can use any small area you name. A set that holds a needle in every direction can even have zero area. So area is the wrong ruler. Mathematicians use dimension instead. They use a strict kind called Hausdorff dimension, a careful way to measure how big a dusty shape is. The Kakeya conjecture says a set with a needle in every direction always has full dimension. In a flat plane that means 2. In our space it means 3.
Roy Davies settled the flat plane in 1971. Hong Wang and Joshua Zahl proved the 3D case in 2025. Wang got a Fields Medal for this work in July 2026.
What is claimed. OpenAI says its model proved the four-dimensional case. The 175-page paper says any 4D set with a needle in every direction has dimension 4. Seeing four dimensions is beyond us. The best we can do is a spinning shadow, then a slice where each needle becomes one speck of dust.
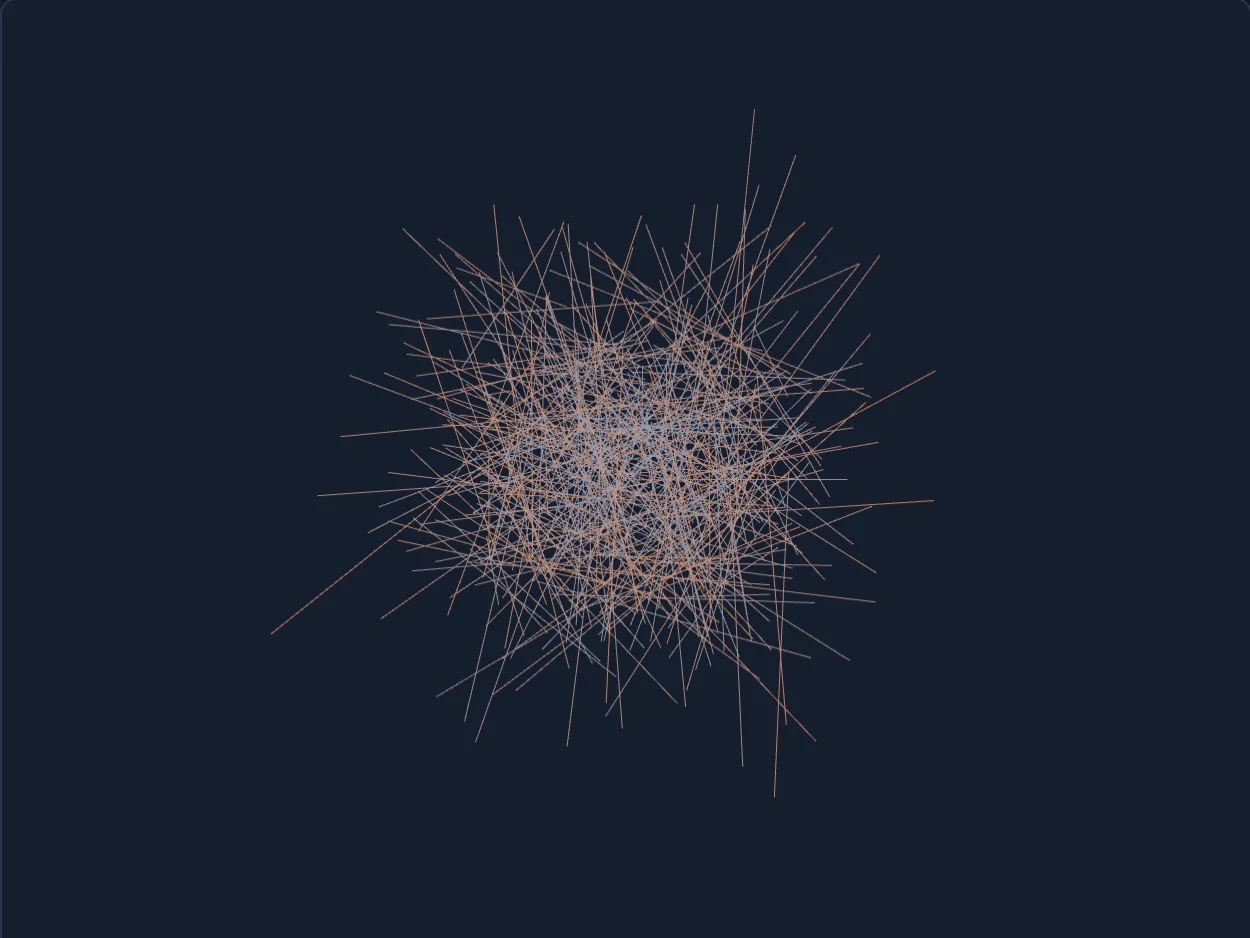
Try it. Drag to turn the cloud. Press Slice, then move the Slice position slider from one end to the other.
What to look for. Each needle crosses the slice at one point at most, so a slice looks like dust. The proof must show that such dust can never be too thin, at any slice.
Play with this figureStatus. Claimed by OpenAI. No outside expert has confirmed it. No journal has refereed it. The repo shows no Lean formalization of this paper. A 175-page proof takes months to referee.
2. Mahler: A Shape and Its Partner
The question. Every shape with a center has a partner shape. In the partner, corners become flat faces, and flat faces become corners. Multiply the size of the shape by the size of its partner. How small can that number get?
A picture to hold. Start with a stick. Push it sideways and it sweeps out a square. Push the square up and it sweeps out a cube. The square's partner is a diamond. The cube's partner is an octahedron, like two pyramids glued base to base. Now do the math. The stick gives 4. The square gives 8. The cube gives 32/3, about 10.67. Each one sits exactly on the floor, the smallest value possible in its dimension.
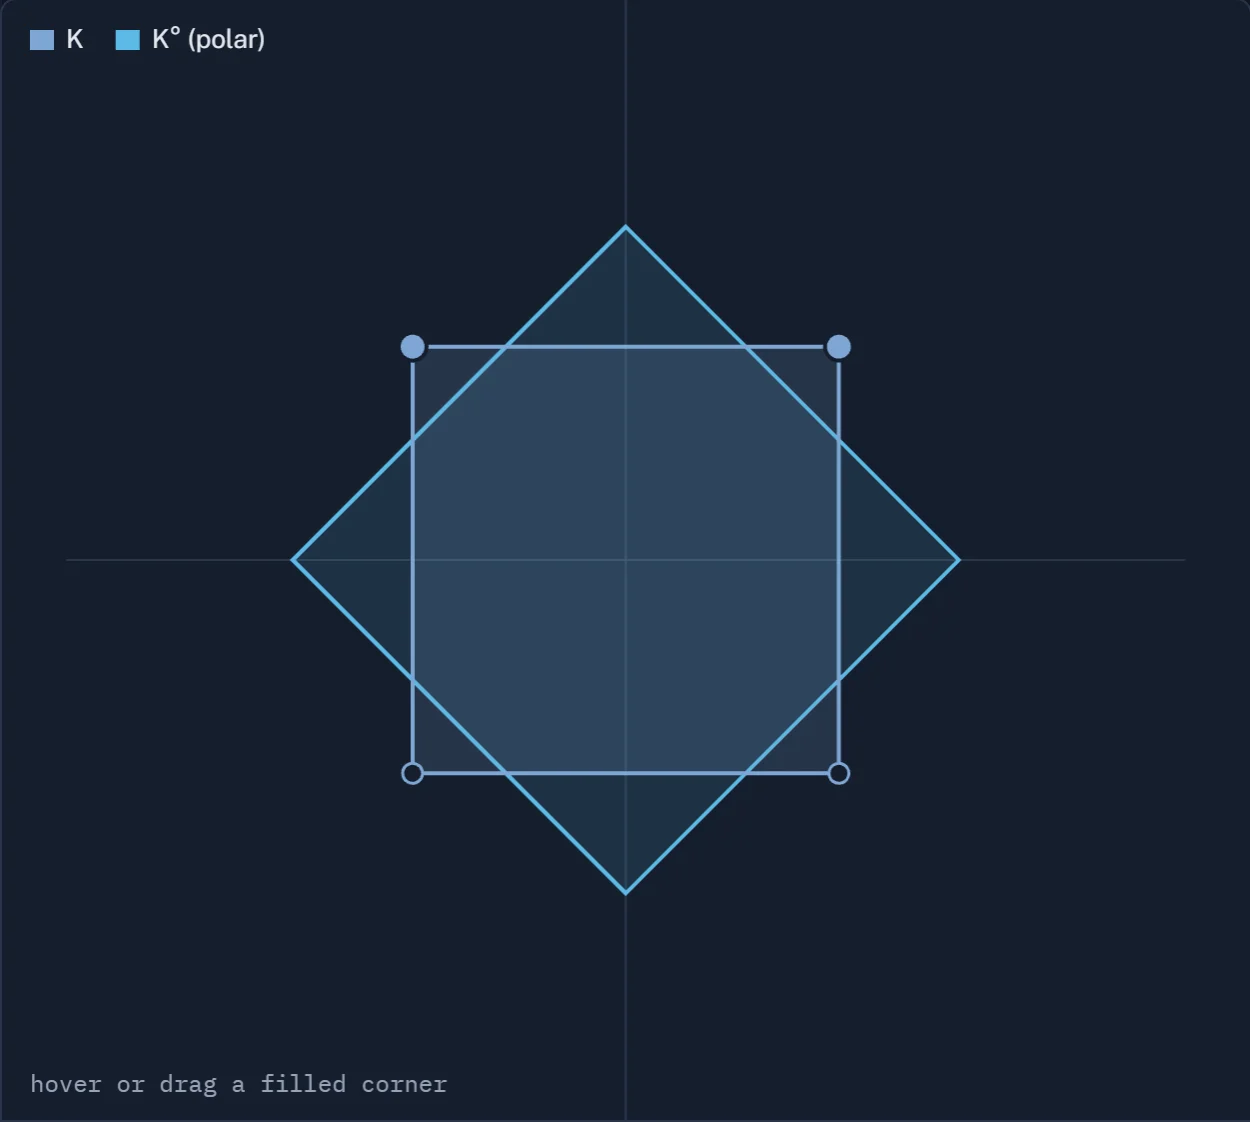
Try it. Choose Square, Hexagon, 16-gon and Lopsided in turn. Then drag a filled corner of the shape.
What to look for. Watch the product |K|·|K°| in the readout. It never drops below 8, the square's value. In the flat plane this floor is an old result. The symmetric paper claims the same kind of floor in every dimension.
Play with this figureTry a hexagon in the plane. The hexagon gives 9, not 8. It sits above the floor. A circle gives about 9.87, the most of all. Fat shapes have skinny partners, and skinny shapes have fat partners, so the product stays surprisingly steady.
Kurt Mahler asked this question in 1939, and he solved the flat case for shapes with a center himself. Meyer finished the flat case for all shapes in 1991. The 3D case for shapes with a center fell only in 2020, to Iriyeh and Shibata. Earlier in 2026, Chen, Li, Xi and Xu posted a human proof for all 3D shapes.
What is claimed. OpenAI posted two papers. The symmetric paper (26 pages) claims the floor holds in every dimension. The general paper (72 pages) claims a lower floor that holds for every shape, measured from its best center point. There, triangles and their cousins give the smallest number. Neither result implies the other.
Status. Claimed by OpenAI. The scope note lists both main statements as formalized in Lean, but the repo's catalogue confirms only the symmetric one. We did not run them. No outside expert has been quoted to check either proof. No refereed version exists.
3. The Fluid Computer: Water That May Know When a Program Stops
The question. Can stirred water act like a computer?
A picture to hold. Think of a pinball machine. Someone sets the bumpers so they act like a computer program. You keep dropping one ball in the same spot. If the program ever stops, the ball rolls into a marked slot. If the program runs forever, the ball keeps bouncing and never reaches the slot.
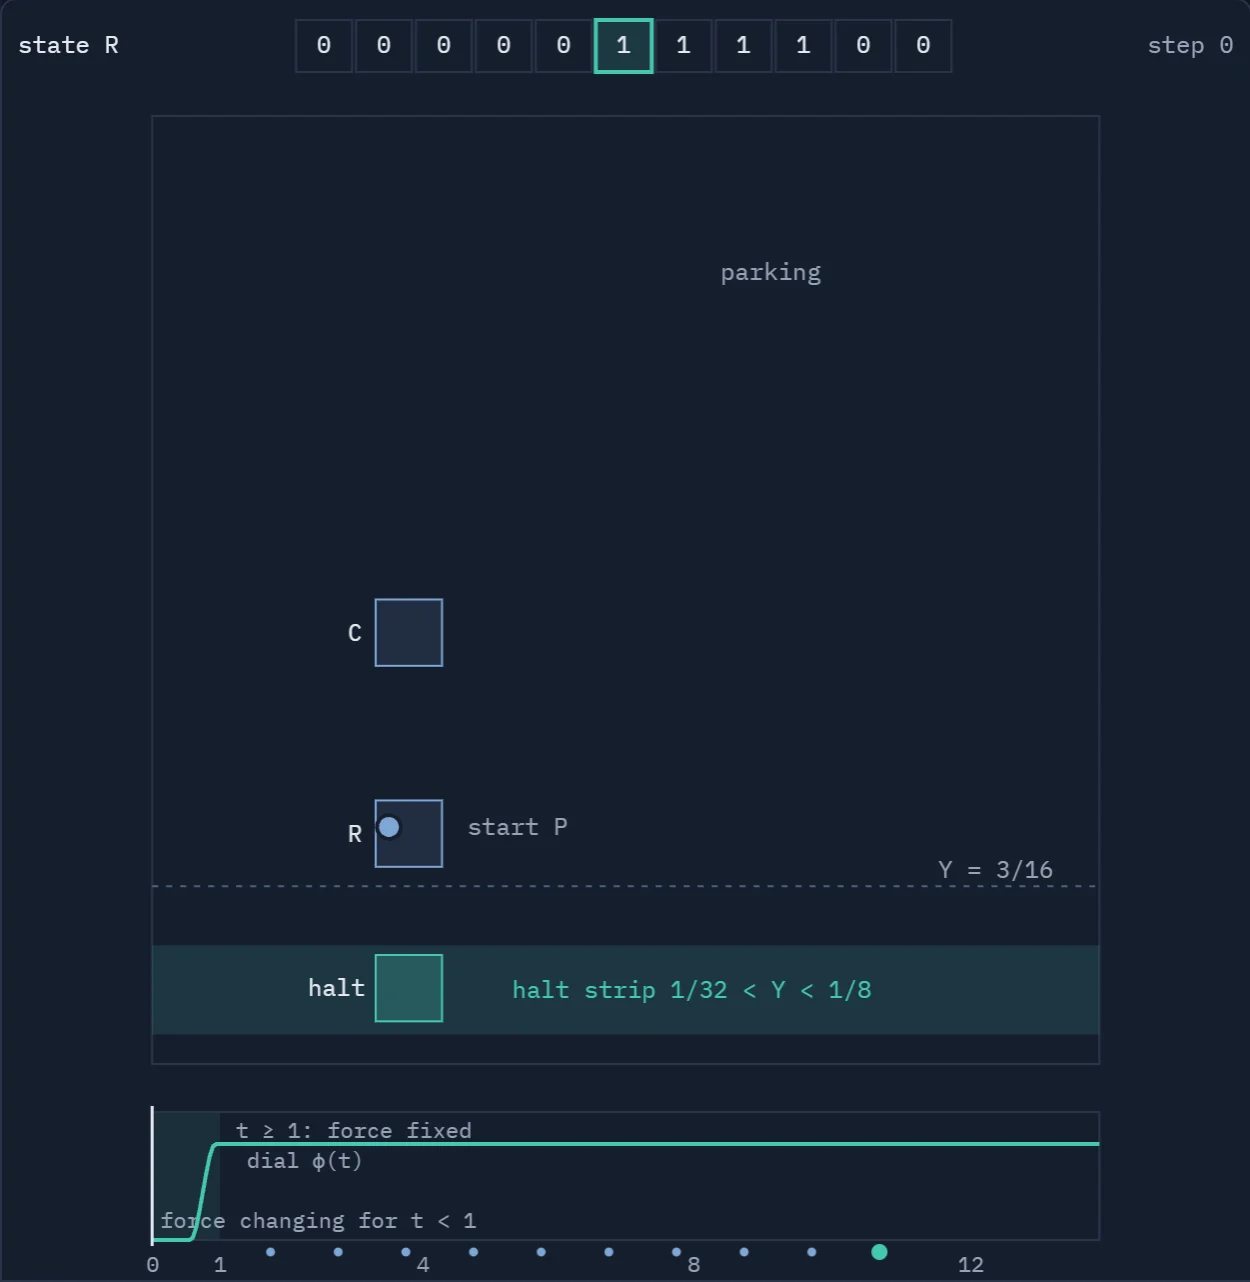
Try it. Choose Binary +1 and press Play. Then choose Ping-pong and press Play again. You can also drag the Time slider.
What to look for. When the program stops, the tracer enters the halt strip. When the program runs forever, it never does. Predicting the fluid is as hard as predicting the program, and that is the claim.
Play with this figureNow picture swapping the bumpers for a way of stirring water. The water sits in a box with its walls glued, so a speck that leaves on the right comes back on the left. The water starts still. One speck of dye sits at a marked start spot.
What is claimed. A 14-page paper claims that you can write a smooth stirring recipe from any program and its input. After time 1 the recipe stops changing. The dye enters a marked zone exactly when the program stops. If the program never stops, the dye never enters the zone.
Why does that matter? In 1936 Alan Turing proved that no method can predict, for every program, whether it stops. So if the claim is right, no method can predict, for every stirring recipe, whether the dye ever reaches the zone. The water inherits the puzzle. Even plain water, stirred in a very special way, can hide a famous unanswerable question.
Fluid computers are not new. Robert Cardona, Eva Miranda, Daniel Peralta-Salas and coauthors built them in other settings starting in 2021. The new part is plain, flat space, water that starts at rest, and the program placed inside the stirring force. This is not a Millennium Prize result.
Status. Claimed by OpenAI. No outside review found. Lean covers sibling papers only, not this theorem. Not refereed.
4. Falconer: When Do Distances Take Up Real Length?
The question. Take a cloud of dust. Measure the gap between every pair of specks. Do the gaps take up real length on the number line, or only a sprinkle of points?
A picture to hold. Pick two dots on a sheet of paper, measuring the gap with a ruler and marking the length on a line. Do it for every pair. A few dots give a few scattered marks. Thick dust lets the gaps take up real length. Some thin dust leaves only a dotted line. Above a certain thickness, no dust can do that, and finding that thickness is the whole game.
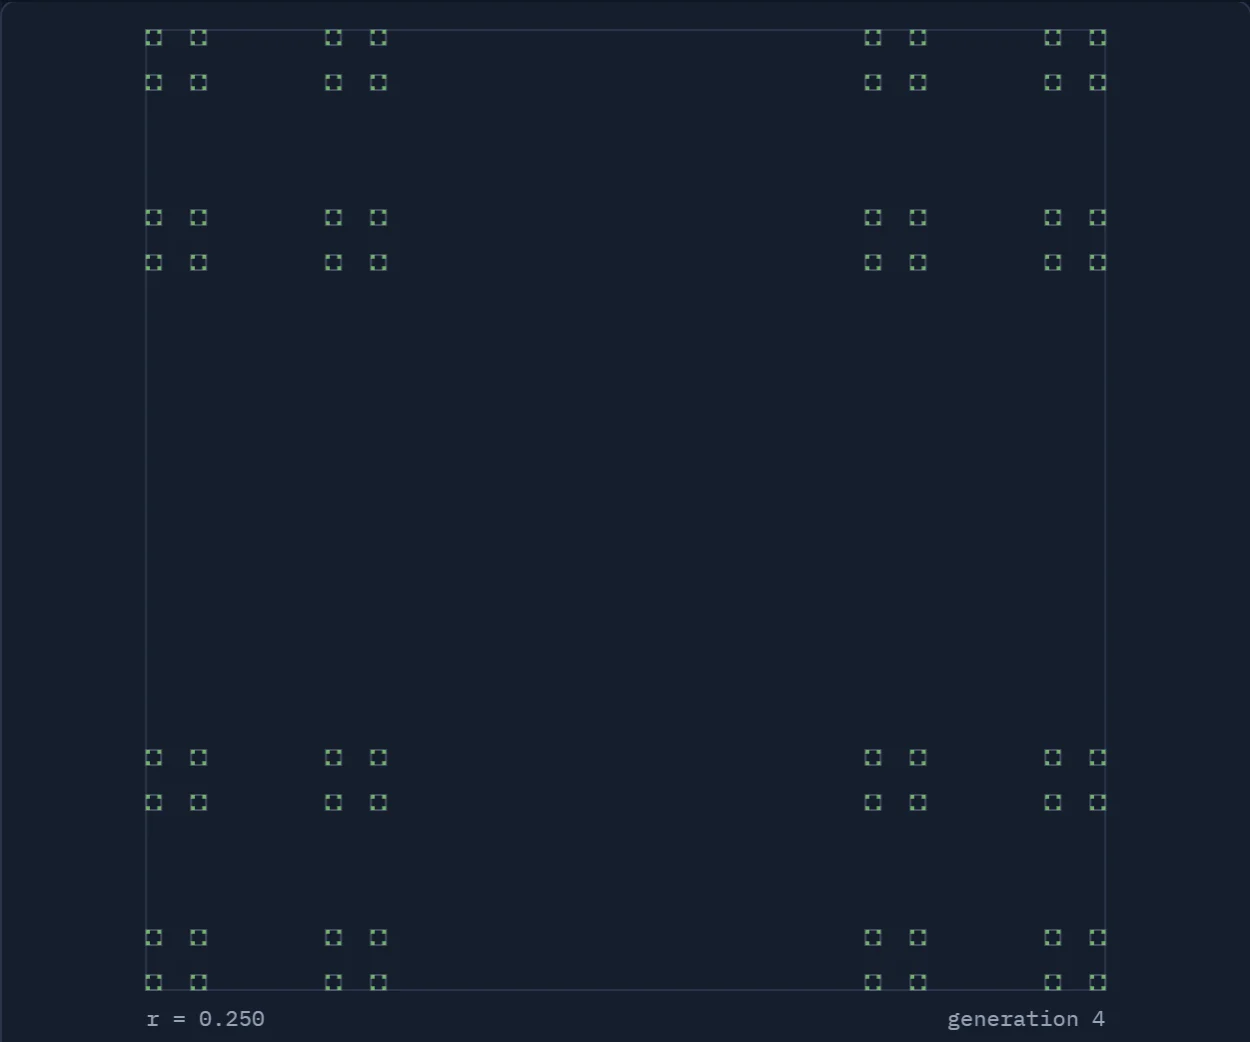
Try it. Move Generation from 0 to 6. Then move the Dimension slider and press Build.
What to look for. Each step keeps four small corner squares inside each square. The area falls toward zero, but the dimension stays fixed. Dimension, not area, is the ruler for these sets.
Play with this figureHere is a way to make dust. Start with a square, keeping only the four corner squares. Do it again inside each corner, and again, forever. Shrinking the corners less makes the dust thicker. At one special size, the dust has zero area but the same dimension as a line: 1.
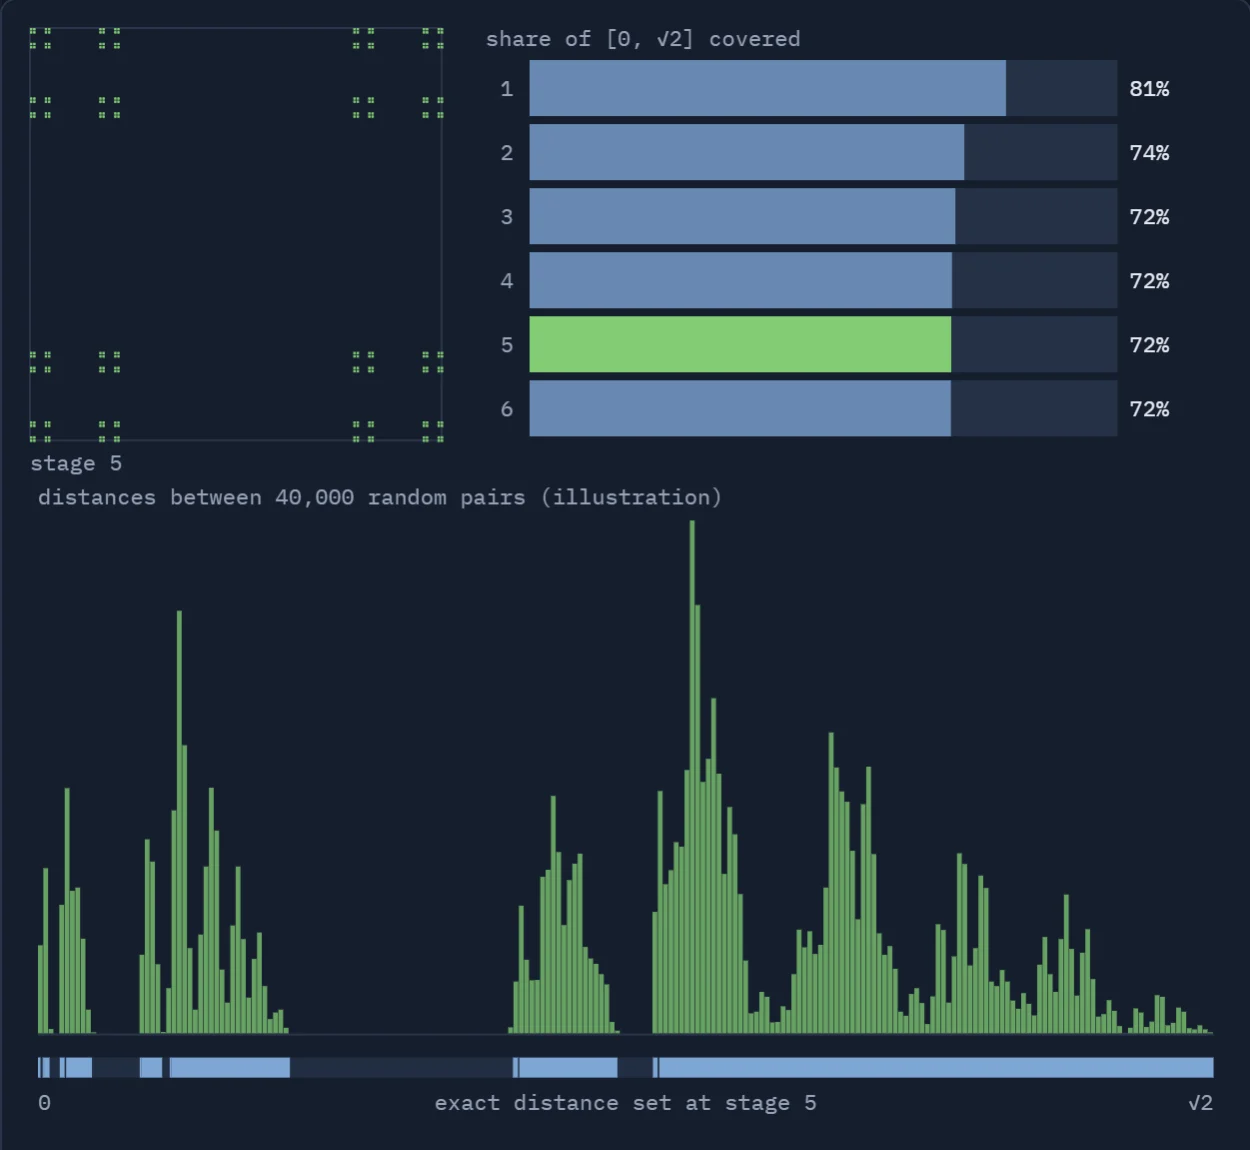
Try it. Leave Dimension below 1 and move Stage from 1 to 6. Then try Lattice dust, or press Sweep dimension.
What to look for. The bars show how much of the distance line the dust reaches. Below the threshold, some sets miss part of the line. Falconer's question asks how big a set must be to reach a solid stretch of distances.
Play with this figureKenneth Falconer asked about this in 1985. He proved part of the answer, and his examples pointed to the rest. The guess says that in a flat plane, dimension more than 1, which is half of 2, is enough. In 3D, more than 1.5 is enough. This question stayed open for about forty years. Thomas Wolff, Larry Guth, Hong Wang and others lowered the bar step by step, and the new paper builds on a theorem by Orponen and Shmerkin. In our own simulation, thin dust at dimension 0.7 drops from 82% coverage to under 2% by the sixth round.
What is claimed. A 64-page paper claims the rule in every dimension. If the dust has more than half the dimension of the space, its distances take up real length on the number line. The rule is "more than half", not "exactly half".
Status. Claimed by OpenAI. OpenAI posted a Lean formalization. We read the Lean files but did not run them. Not peer reviewed. No outside expert has confirmed it.
5. Hadwiger: An 80-Year-Old Coloring Rule May Fall
The question. Draw dots and join some pairs with lines. Color the dots so no two joined dots share a color. Some pictures need many colors. In 1943 Hugo Hadwiger guessed a rule. If a picture needs k colors, you can squeeze its dots into k groups. Each group hangs together, and every group touches every other group.
A picture to hold. Think of a lock made of 1s and 0s. Each pair of dots missing a line gets a token worth 1. The rules demand that three such tokens in a triangle add to 0. But 1 + 1 + 1 gives 1 in this arithmetic, where 1 + 1 = 0, like a light switch flipped twice. So a triangle of missing lines can never exist. That means no three dots are all strangers to each other.
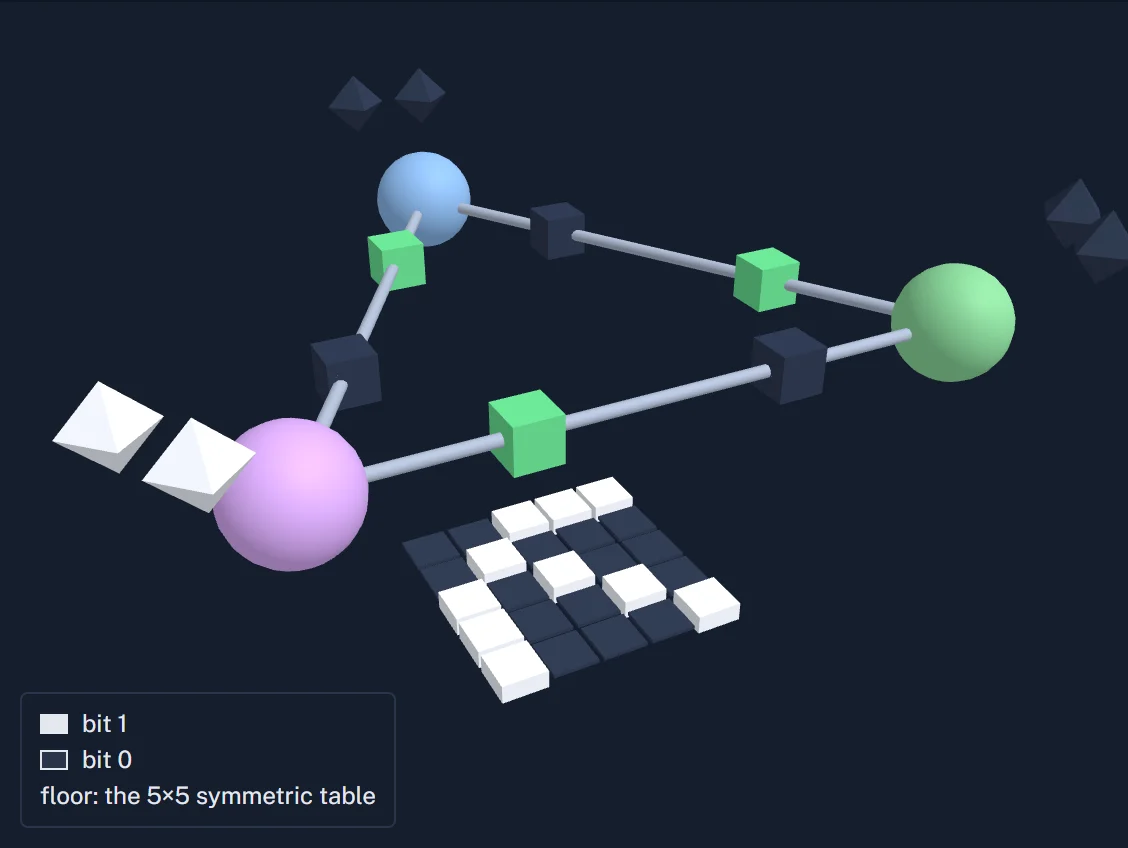
Try it. Drag to turn the picture. Press New random table a few times.
What to look for. Each pair of dots that is missing a line gets bits that must add up a certain way. No table can satisfy three such pairs in a triangle. So no three dots are all strangers, and each color can hold at most 2 dots. The paper's huge examples are built on this lock.
Play with this figureNeil Robertson, Paul Seymour and Robin Thomas proved the rule up to 6 colors in 1993. The Four Color Theorem handles one of those cases. In late 2025, a human team of Kuhn, Sauermann, Steiner and Wigderson broke a close cousin of the rule, the odd Hadwiger conjecture.
What is claimed. A 104-page paper claims the rule is false. It builds huge pictures that need more colors than the rule allows. Because no three dots are strangers, each color can hold at most 2 dots. Plug 1,000 dots into the paper's formulas as a test: the coloring would need at least 500 colors, but the squeeze would allow at most 346 groups. As the pictures grow, the colors needed stay at least about 1.44 times the squeeze. The real examples are far larger than 1,000 dots, astronomically large. Nobody can draw one.
The lock is the easy part. Most of the 104 pages do the hard part.
Status. Claimed by OpenAI. Lean files cover the main statement, but we did not run them. On October 7, Gil Kalai wrote that human mathematicians must still check and digest these results in the months to come. Not refereed.
6. Penrose: Must a Black Hole Weigh Enough for Its Size?
The question. Can a black hole be very large and very light?
A picture to hold. Space near a black hole is stretched. Drawing that stretch as height gives a funnel. The narrowest ring of the funnel is the edge of the black hole. Imagine looking down into a whirlpool frozen in glass. For a plain black hole, the size of that ring and the mass lock together exactly.
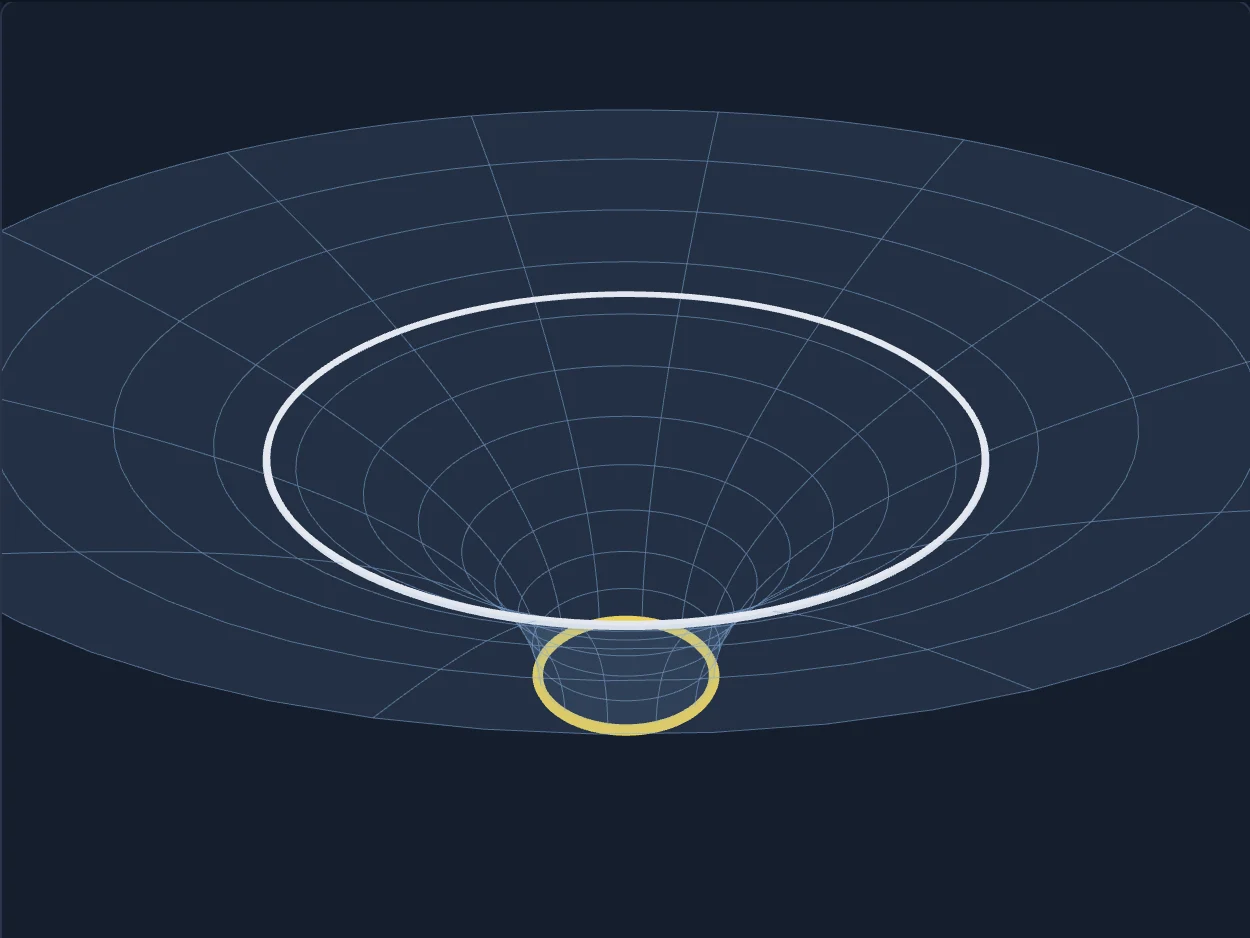
Try it. Move the Mass slider. Move the Ring slider down toward the horizon. Press Both sides to see the full funnel.
What to look for. The horizon area grows with the mass squared, and the readout checks it: the square root of area over 16π gives the mass back. The Penrose inequality says a black hole can never weigh less than that.
Play with this figureIn 1973 Roger Penrose made a guess. The mass you measure from far away can never be less than the square root of the area divided by 16π. The new papers use the area of the smallest surface that wraps around the black hole. A big empty box can be very light. A black hole is different: its size sets a floor for its weight.
In 2001, Gerhard Huisken and Tom Ilmanen, and separately Hubert Bray, proved the frozen-snapshot case, using two different methods. Huisken and Ilmanen pushed a lumpy surface outward while it grew rounder and rounder. The sharp general case, with things in motion, stayed open. In 2025 Allen, Bryden, Kazaras and Khuri proved a weaker version.
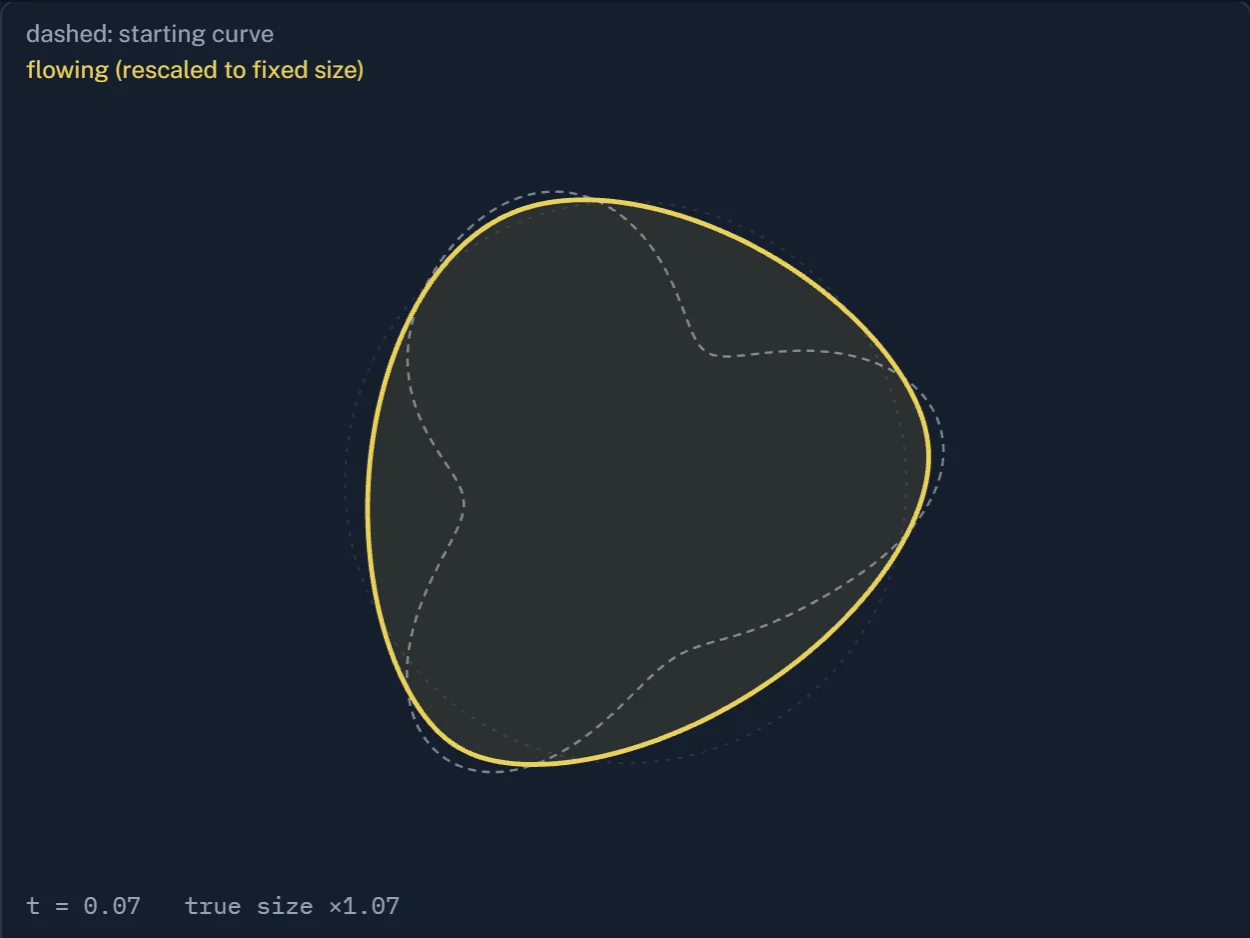
Try it. Choose a starting shape: Lobes, Dented, Boxy or Rough. Then move the Flow time slider slowly.
What to look for. Every shape grows and rounds out. The roundness number falls toward 1, a perfect circle. A flow like this, in 3D, is the tool behind the 2001 proof that this new work builds on.
Play with this figureThat second picture is a flat cartoon of the 2001 idea. It is not how the new paper works.
What is claimed. OpenAI posted three papers, dated October 5, 2026. The 262-page paper claims the general case in three and four space dimensions. The 91-page paper adds electric charge. The 88-page paper covers spinning black holes, but only if they are symmetric around an axis, with more conditions.
Status. Claimed by OpenAI. Not formalized in Lean. No peer review. No outside expert has checked it.
7. Liouville Quantum Gravity: Do Random Triangles Become a Rough Sphere?
The question. Glue many triangles together at random into a ball, with loops drawn on it, where the loops help decide which balls are likely. What does it look like when the ball gets huge?
A picture to hold. Think of a coastline seen from a plane. Millions of tiny rocks and waves make one wiggly edge. Zoom in, and it is still wiggly. Every coastline is different, but they all share the same kind of roughness. Here the tiny random choices are the triangles and loops. The big pattern is one special kind of random shape.
The loops and the ball are chosen together, edge by edge, so a dial called q changes both. The first picture shows loops on a flat grid, not on a ball. Turning q changes the character of the loops.
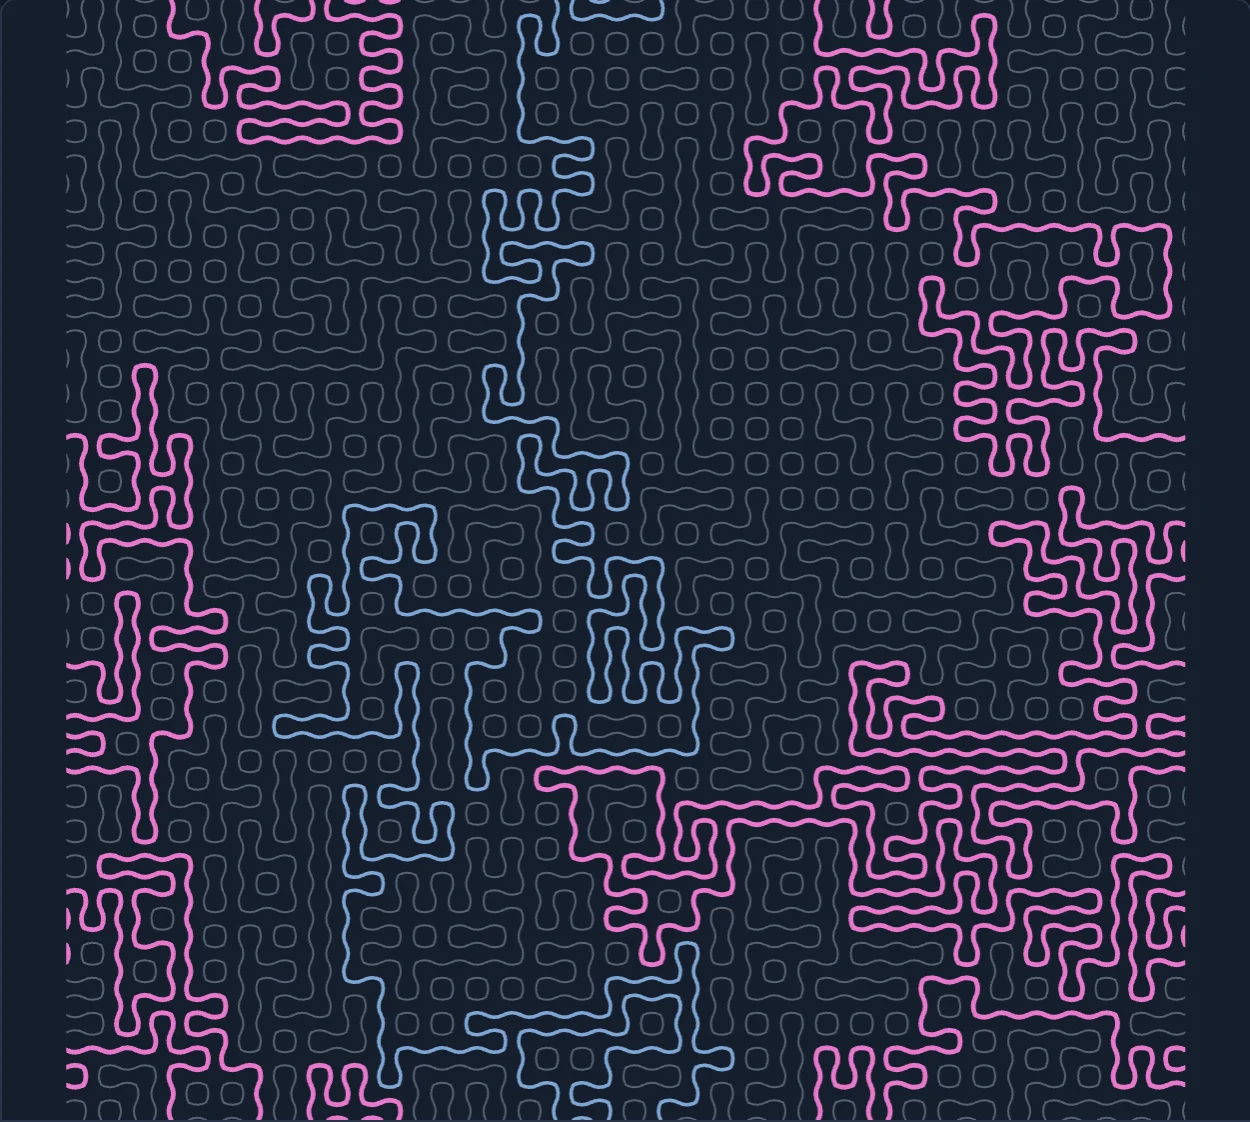
Try it. Move the q slider. Switch between Loops and Clusters.
What to look for. The dial q changes how the loops wind and how big the clusters get. In the paper, the same dial also shapes the random sphere that the loops live on.
Play with this figureScott Sheffield, Jason Miller, Ewain Gwynne, Nina Holden, Xin Sun and others built this field over fifteen years. Holden and Sun wrote down the guess these papers target.
What is claimed. Two papers, 123 pages and 217 pages, make the claim. As the ball grows, it settles into one special kind of random, rough, fractal sphere with wiggly loops on it. Fractal means rough at every zoom level. One paper covers every q between 0 and 4. The other handles q = 4 exactly, where it builds a new kind of sphere.
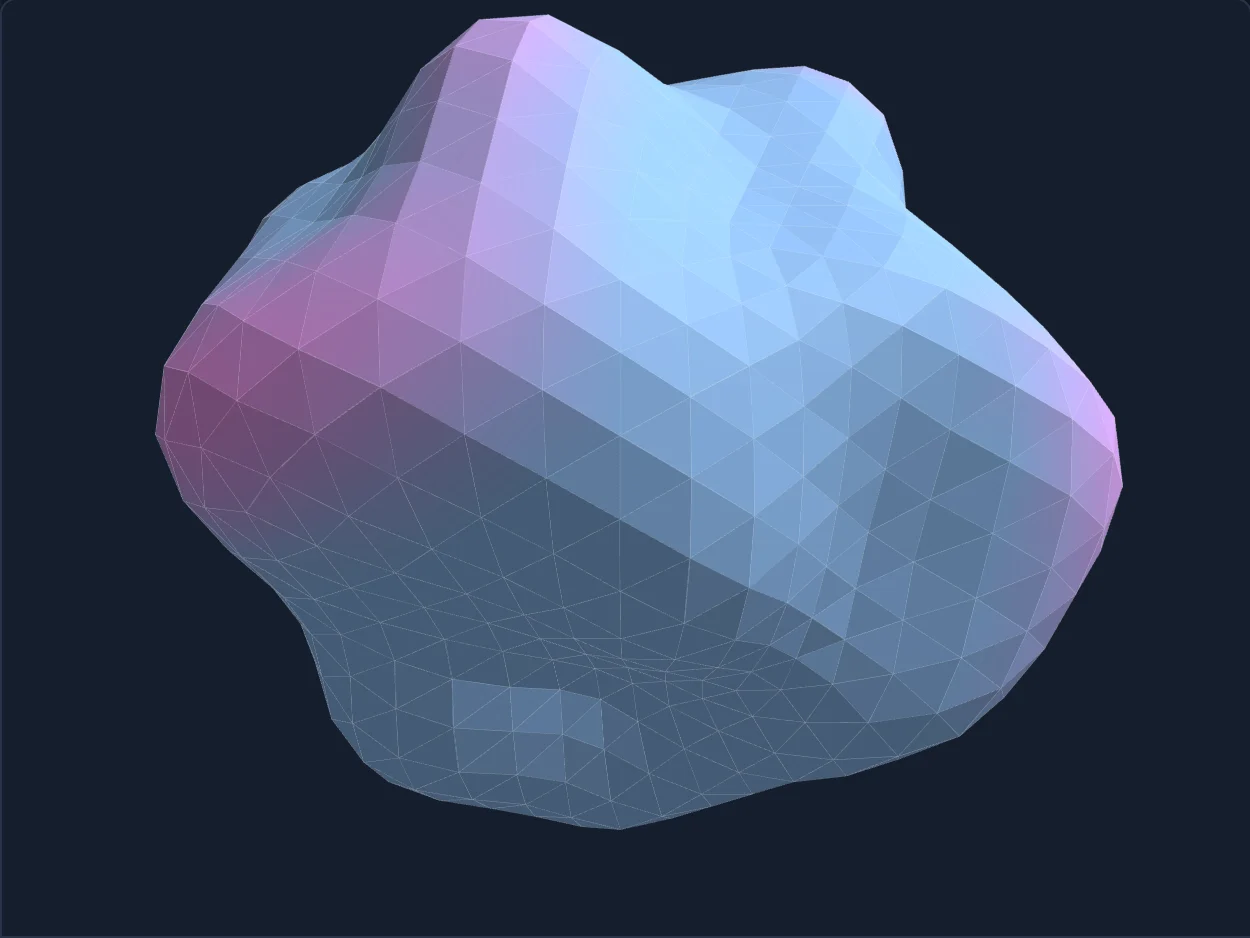
Try it. Drag to turn the sphere. Move the q slider, and press New field for a new random shape.
What to look for. The first readout line is exact: q fixes the constants. The lumps are an illustration of how a random surface can look, not the paper's object.
Play with this figureThis bumpy ball is an illustration, not the real object.
Status. Claimed by OpenAI. Neither paper has a Lean formalization. No refereeing and no named expert comment found.
8. Zeta Zeros: A Straight Wall in a Bumpy Field
The question. Where are the zeros of the zeta function? The answer controls how evenly the prime numbers spread out.
A picture to hold. Picture a huge bumpy field. The height at each spot shows how big zeta is there. Some spots have pits, places where zeta is touching zero. The first pit sits at height 14.13. Below height 60 there are 13 pits, all on one line, the line 1/2.
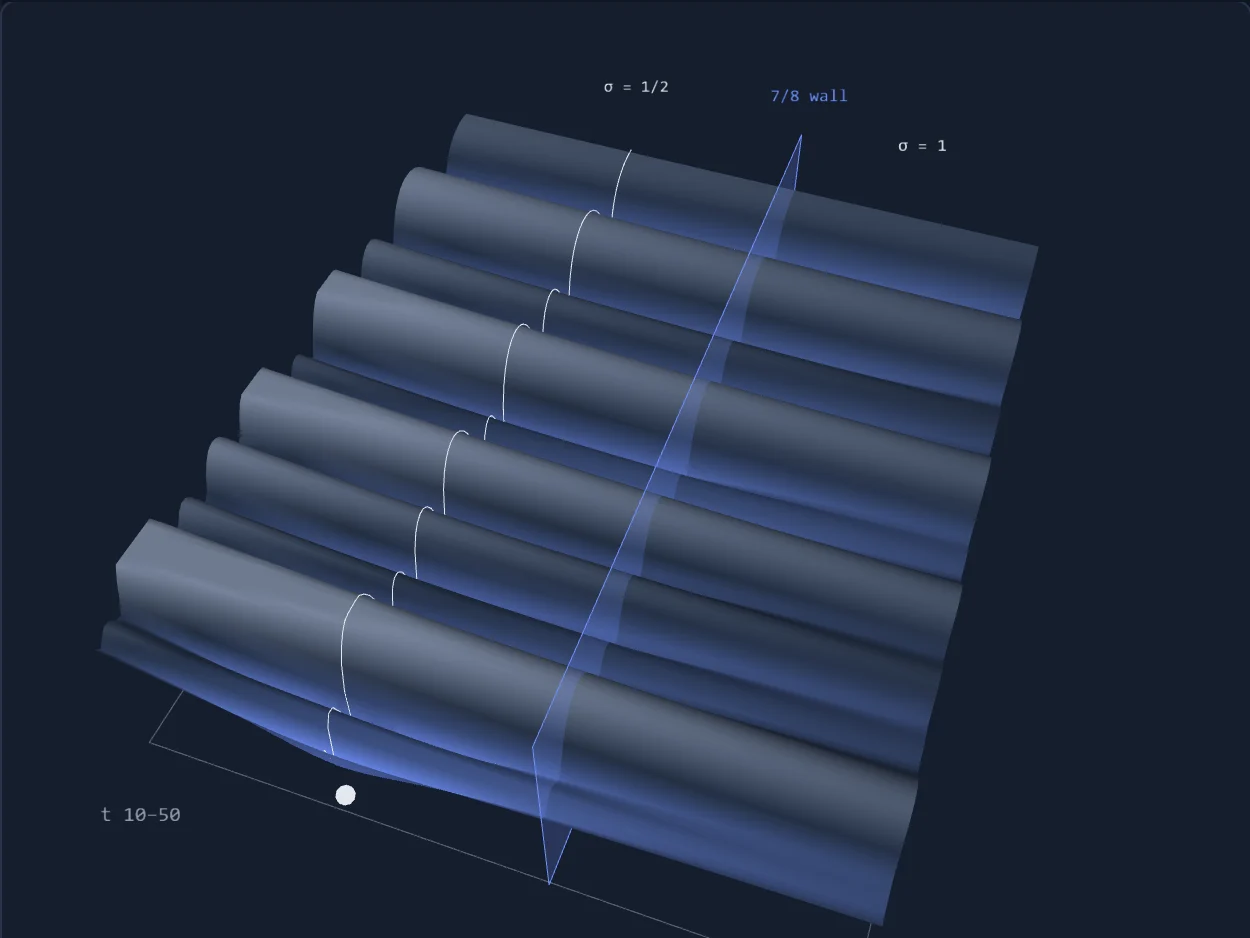
Try it. Drag to turn the landscape. Move Height from to look higher up the line. Switch Colour by size and Colour by direction.
What to look for. Every pit on the line at one half is a zero. The readout checks one of them by computing ζ there. The Riemann hypothesis says no pit ever sits off that line.
Play with this figureAll the pits that matter live in a band between 0 and 1. For over a hundred years, people could only promise a thin strip with no pits, near the line 1. The strip got thinner the higher you looked. The Riemann hypothesis says every pit in the band sits on the line 1/2. That is still open.
What is claimed. A 199-page paper claims a straight wall, the first anyone has claimed: no pits lie to the right of 7/8, at any height. The claim covers zeta and its cousins, the Dirichlet L-functions. A separate 9-page paper claims a weaker result, about so-called Siegel zeros, by a different method. The 7/8 wall would rule those out too.
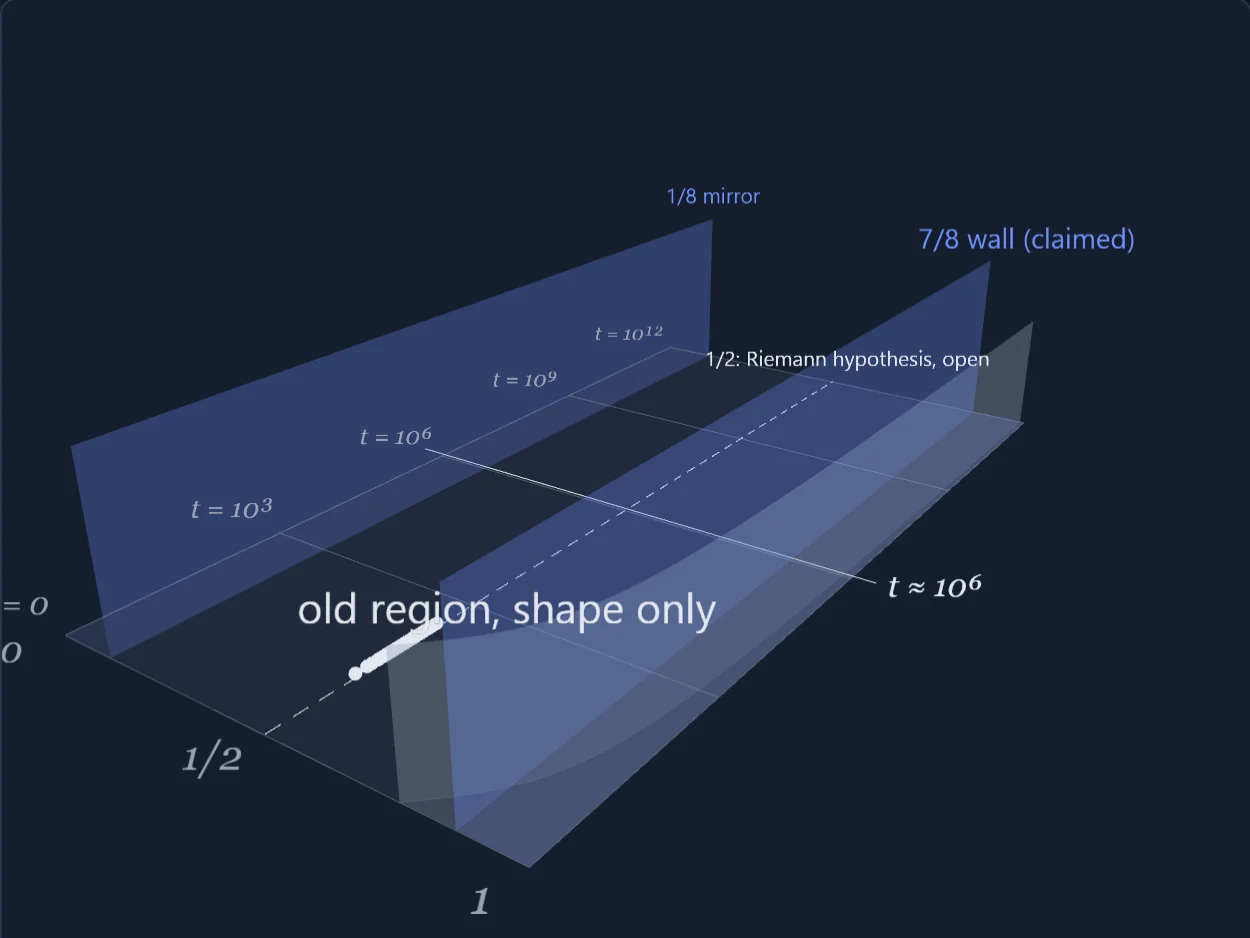
Try it. Move the Climb slider up to 10¹². Press the buttons to show or hide each wall.
What to look for. The old zero-free curve creeps toward 1 as you climb. The claimed 7/8 wall stays straight at every height. A straight wall is what makes the claim new.
Play with this figureHector Pasten, at the Pontifical Catholic University of Chile, said this about the Siegel result: "This is not just progress on Siegel zeros, it settles the question." On zeta he was more careful: "Some people claim it is progress toward Riemann; other people say it's not." He did not say he had checked the proof, and Scientific American noted that no one had read all of it yet.
Status. Claimed by OpenAI. The repo documents a Lean formalization, but we did not run it. No outside referee report. The Riemann hypothesis is not solved.
9. Matrix Multiplication: A Faster Way, on Paper
The question. Computers spend all day multiplying big tables of numbers. The school method for two n by n tables takes n × n × n steps. Double the size and the work grows eight times. How slowly can that work grow?
A picture to hold. In 1969 Volker Strassen found a trick. For a 2 by 2 block, he used 7 multiplications instead of 8. Repeating the trick on blocks inside blocks makes the savings grow: 7, 49, 343 against 8, 64, 512.
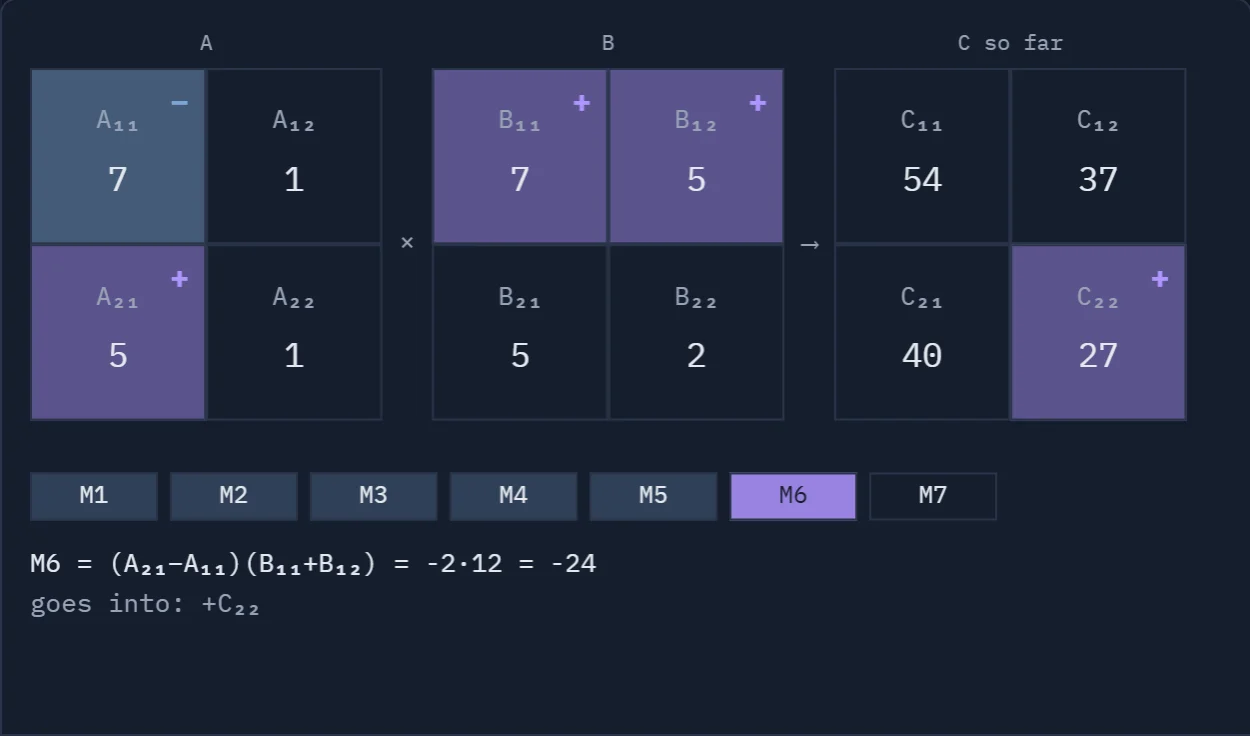
Try it. Switch between Schoolbook and Strassen. Move Recursion levels up.
What to look for. Seven products instead of eight looks like a small saving. Repeated at every level, it cuts the work for big tables by a lot. That is why omega, the exponent, is below 3.
Play with this figurePeople measure the speed with an exponent called omega. Lower is faster, and the school method scores 3. Strassen brought it to about 2.81. Over 57 years, Coppersmith, Winograd and many others brought it to about 2.371. A separate OpenAI paper, posted in September, had already claimed 2.258.
What is claimed. A 13-page paper, dated October 2, 2026, claims omega is at most 2.25. It takes a new route, not the old method. Its key picture is a staircase of cubes. The proof splits it into three pieces. The pieces slide apart, but they still share one axis. Untangling that shared axis is one hard part. A counting argument about growth does the rest.
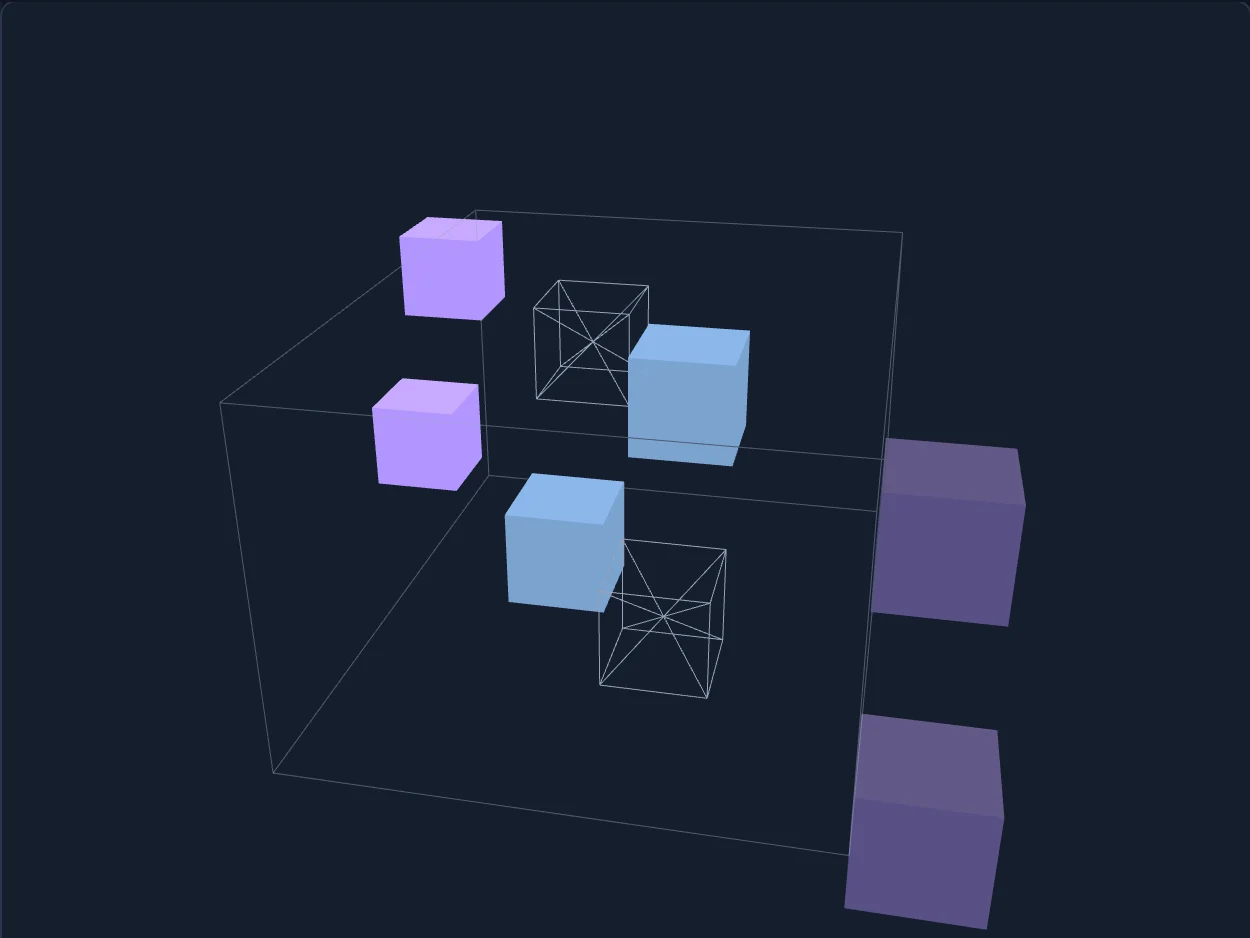
Try it. Drag to turn the box. Change First length a and Block size h, then press Pull apart.
What to look for. The products split into three blocks that still share one axis. The readout counts which products are kept and which cancel. That shared axis is one hard part the proof must untangle.
Play with this figureThis is a promise in theory that a faster way exists. It gives no program and does not make today's computers faster. It is not a claim that 2.25 is the best possible; the true value could be as low as 2. The paper proves it for complex numbers. It makes no claim for other number systems.
Status. Claimed by OpenAI. The repo lists it as formalized in Lean, but the Lean note links other papers, and we did not run it. Not peer reviewed.
10. Spin Glasses: The Recipe for a Messy Magnet
The question. Physicists had a recipe for one key number of a messy kind of magnet, its free energy. Does the recipe give the exact answer?
A picture to hold. Put three tiny magnets in a triangle. Each one points up or down. Every pair is trying to point opposite ways. Try all 8 arrangements. At least one pair is always unhappy. Physicists call that frustration.
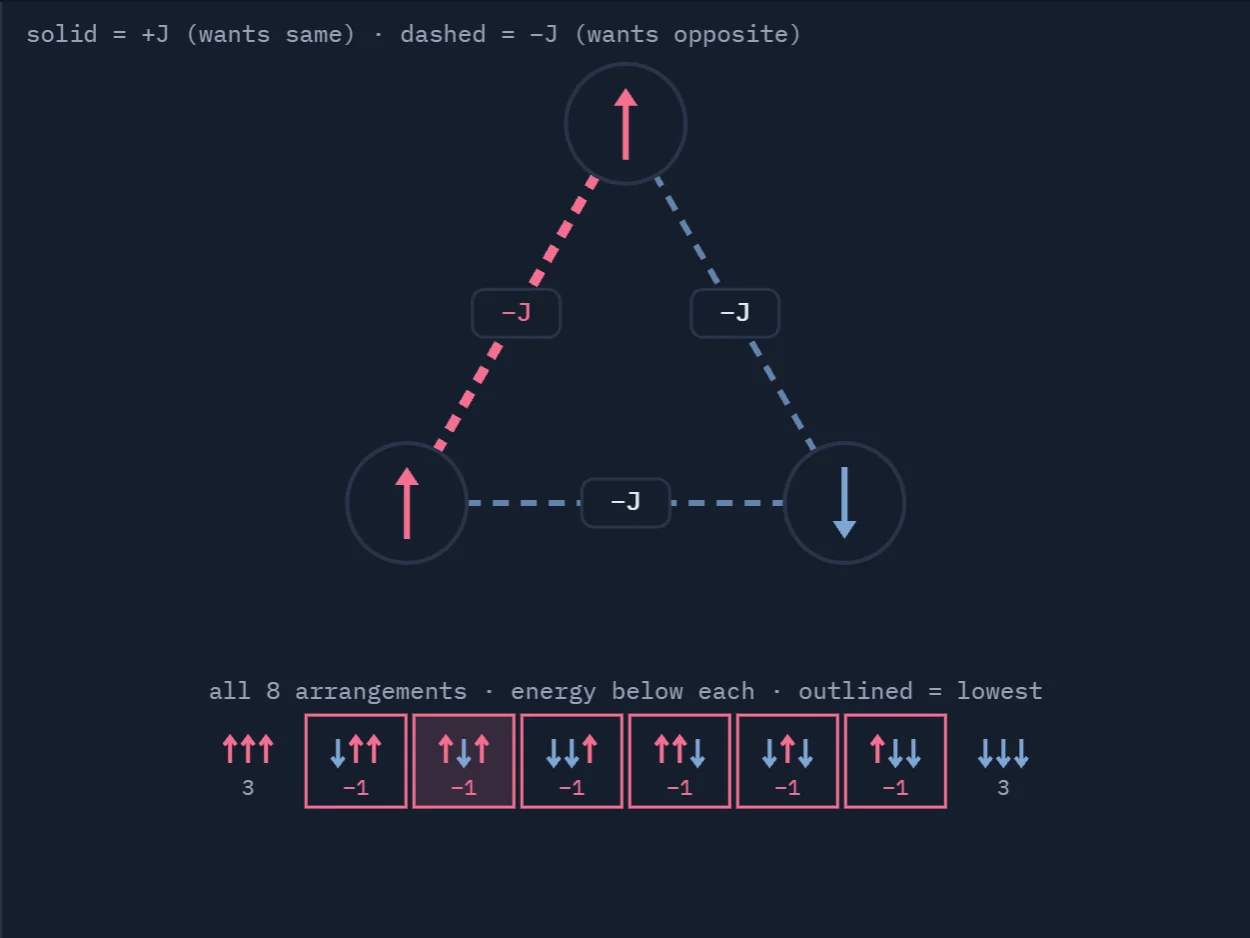
Try it. Click the spins to flip them. Choose Triangle, then the two Square options. Press Show a best state.
What to look for. On the triangle, at least one bond always stays unhappy, whatever you flip. That is frustration, and it gives spin glasses their many deep valleys.
Play with this figureNow imagine thousands of magnets, each touching only a few others, slowly cooling down. Physicists picture a bumpy landscape with many dips. Cool it twice and you may land in two different dips. Similar dips group into clans, like a family tree. That picture is intuition only. The proof does not use it.
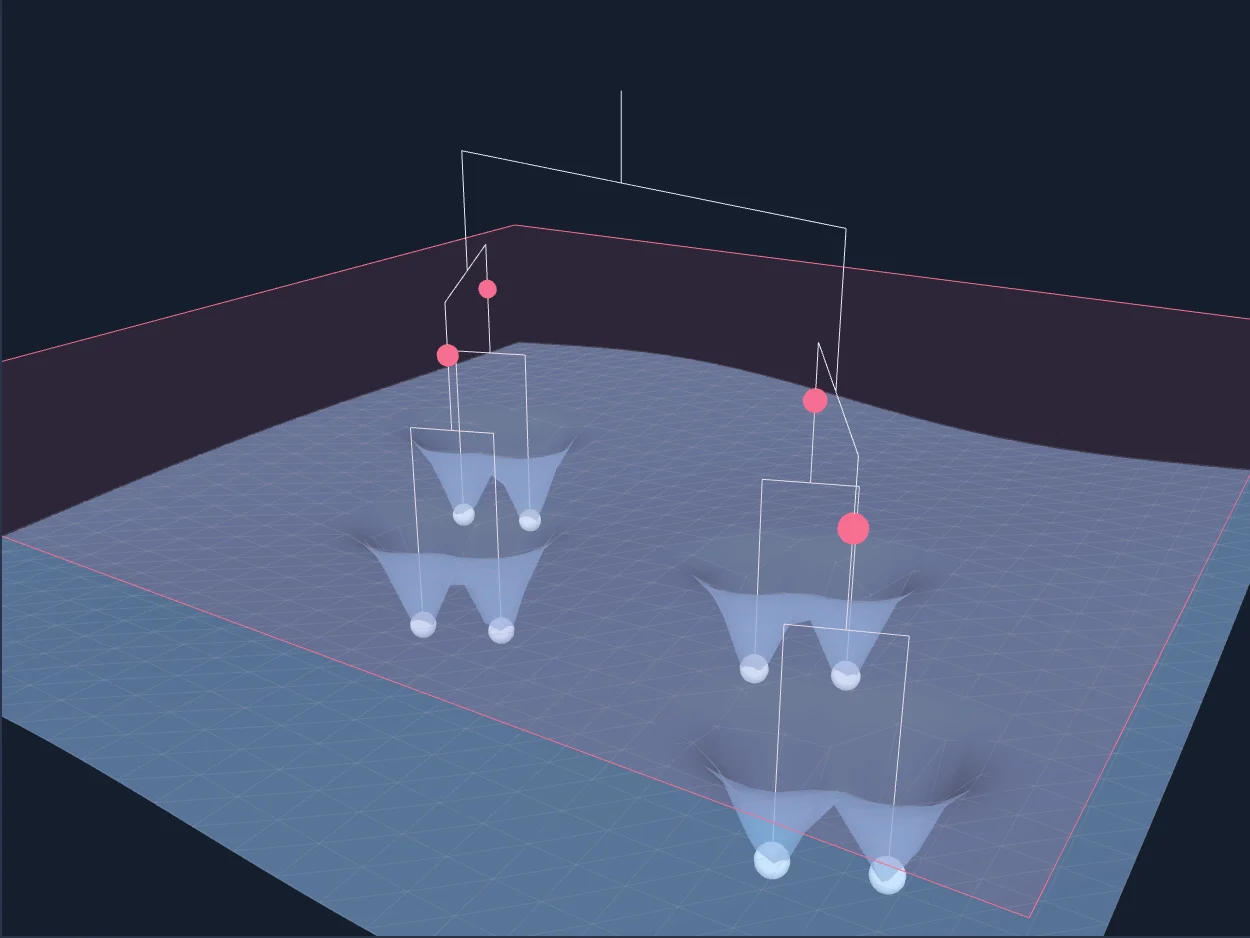
Try it. Drag to turn the scene. Move the Cut height slider up and down.
What to look for. Low cuts split the valleys into many small clans. High cuts join them. This tree of valleys is the classic picture of a spin glass; the manuscript does not assume it.
Play with this figureMarc Mézard and Giorgio Parisi gave the recipe in 2001. In 2004 Dmitry Panchenko and Michel Talagrand showed the recipe never goes too low. They guessed it is exactly right.
What is claimed. A 36-page paper claims to prove that guess for a certain class of sparse magnets. It does not cover every spin glass.
Status. Claimed by OpenAI. OpenAI lists a Lean formalization, but a third-party reading of the repo says its review status is marked "unchecked", and whether the formal statement matches the paper still needs a human reader. We did not run it. Not peer reviewed. No expert assessment found.
11. Vlasov-Maxwell: A Plasma That May Never Break
The question. A plasma is a gas of charged particles. Each particle makes electric and magnetic fields, and those fields push every other particle. Can the math for this ever break in a finite time?
A picture to hold. Think of runners on a track with a speed limit, light speed. Nobody runs faster than the limit. But each shove still adds oomph, and oomph has no limit. The worry was that oomph could pile up without end in a short time, and the math would break.
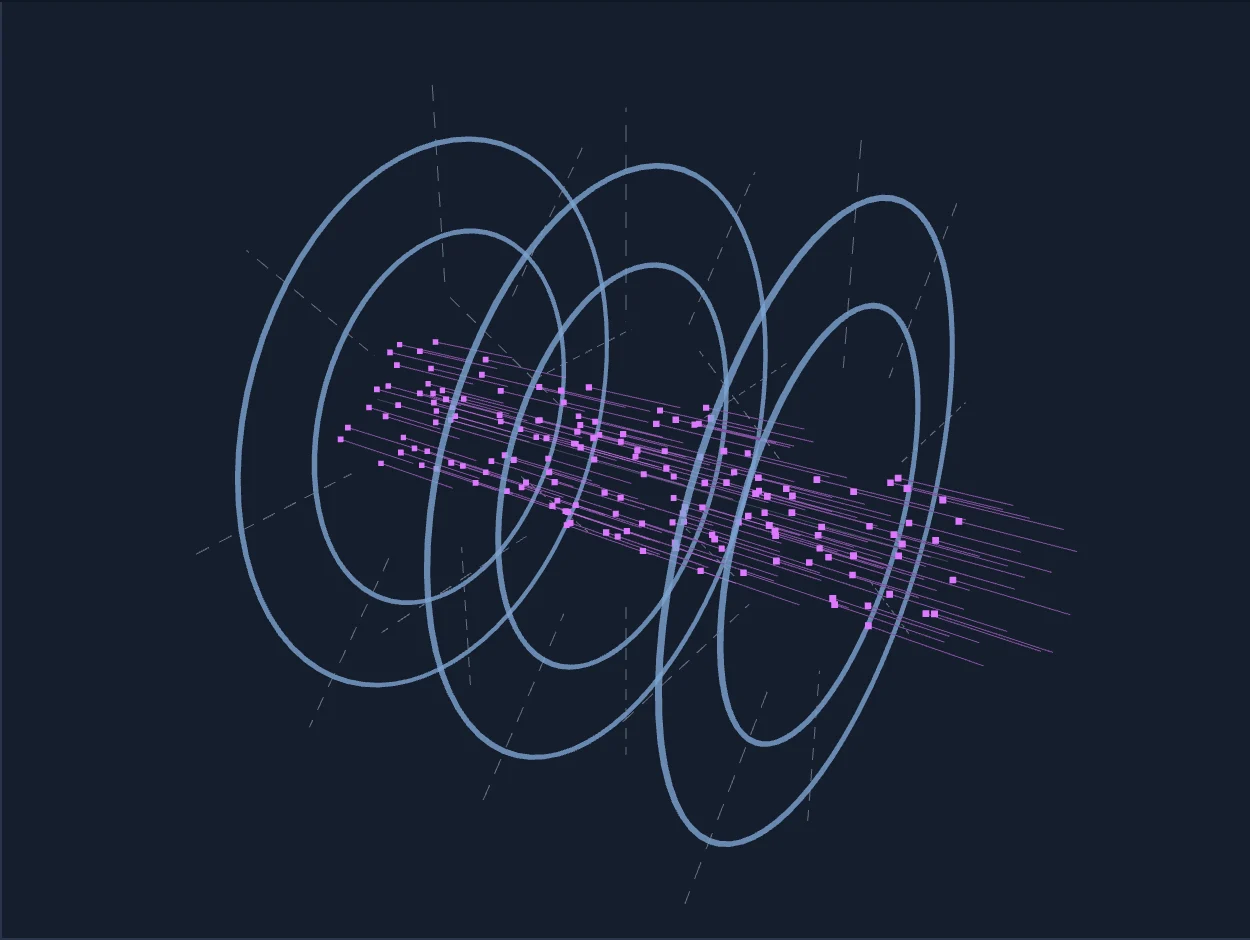
Try it. Move Beam momentum up. Switch Magnetism on and off, then press Restart beam.
What to look for. At high speed, the magnetic pull almost cancels the electric push, and the readout shows the ratio. That near-cancellation is part of why fast particles are hard to control in the real equations.
Play with this figureIn the picture, like charges push the beam apart. Magnetic rings keep squeezing it back. The faster the beam goes, the more the squeeze cancels the push. This is a toy, not a real solution.
Speed cannot pass light speed, but momentum, the "oomph" of a particle, can keep growing. In 1986, Robert Glassey and Walter Strauss showed one thing. The only way the math could break is if momentum grows without limit in a finite time.
What is claimed. A 49-page paper claims that this never happens in 3D, for a plasma of one kind of particle with no collisions, starting in a bounded region. Plasmas that mix two kinds of particles are not covered. Each time the top momentum doubles, it takes a bit of time. Those little times add up to forever. The breaking point keeps sliding away, and it never arrives. So the math stays smooth on every finite stretch of time.
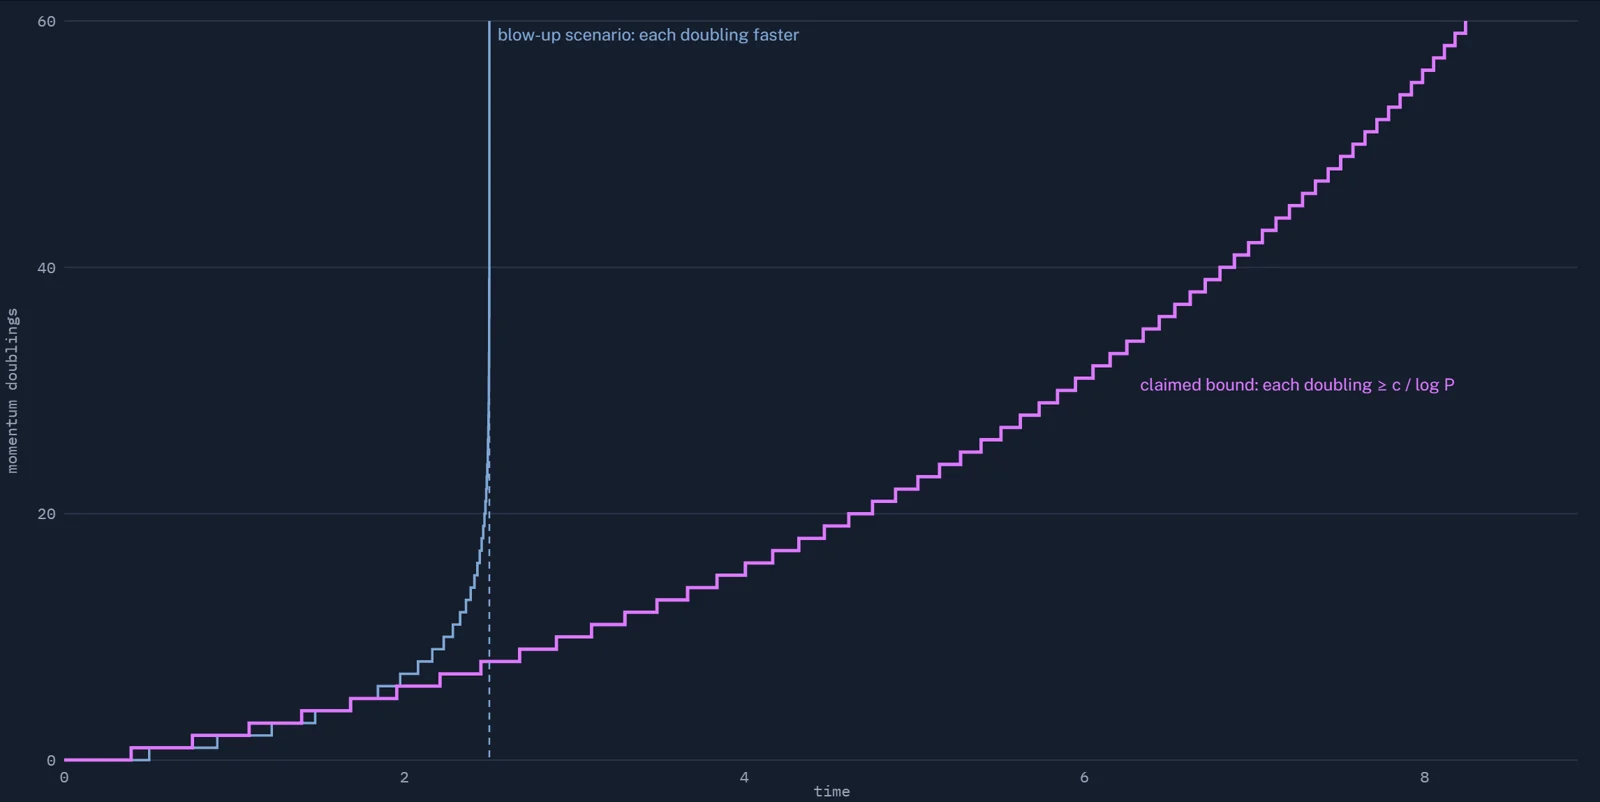
Try it. Move Doublings up. Then move Constant c and the Blow-up shrink factor.
What to look for. A blow-up must fit infinitely many doublings into a finite time. The claimed bound makes each doubling take a little time, and the total grows without limit. So the blow-up path can never be followed.
Play with this figureStatus. Claimed by OpenAI. OpenAI lists it as formalized in Lean. We did not compile it. No peer review and no specialist reaction found.
How to Read a Claim Like This
A claim is not yet a proof that everyone accepts. Turning one into the other is slow, careful work.
First, experts read the paper, checking it line by line. For a 175-page paper, that takes months. Second, a journal sends it to referees, who try hard to break it. Third, other mathematicians start building on the result. A result that survives all three becomes part of mathematics.
Lean can help. It checks every step a computer can follow. But Lean checks a proof against a statement that a person wrote. If the statement says the wrong thing, Lean will happily check the wrong thing. So a person must still read the statement. Checking the question is as important as checking the answer.
Remember the three withdrawn manuscripts: one sign error broke one argument and two papers resting on it. Other errors may take longer to find.
So here is a simple rule for the next few months. When you read "AI proves", ask three questions. Did outside experts check it? Did a journal referee it? Does a Lean file match the real statement? Until the answers come back, the right word is claimed.
None of this is a reason for gloom. The wonder is still real. Needles, water, dust, black holes and magnets all hold questions that people chased for decades. Now a machine says it has answers. Soon we will know which answers hold. Waiting for that news is part of the fun.